Sea charts are crucial on board ships. But how and why did the sea chart come into being? The cartography exhibition Charting the Sea explores the history of sea charts together with maritime atlases and survey instruments.
The sea has been mapped for centuries. Maps showing water depths, positions of buoys, compass directions, coastlines and lighthouses give navigators direction and guidance. From the late 15th century, documents were printed that brought all this information together. Sea charts make an area accessible for trade and fishing, but also for war and colonial expansion. The areas where the stakes are highest are represented most often and in the greatest detail.
History of Dutch nautical charts
The exhibition shows the development of the Dutch nautical chart in a bird's-eye view. It focuses on the question: why is the sea mapped? Charting the sea shows sea charts and texts from the 16th century, Dutch sea atlases and sailor's guides by Willem Jansz. Blaeu. Also on display are manuscript maps commissioned by the Dutch East India Company and West India Company, 19th and 20th century maps of the waters around The Netherlands and its former colonies, and water sports charts from the 1960s onwards. A special object is the stick chart, made on the Marshall Islands, showing sea currents and wind directions.
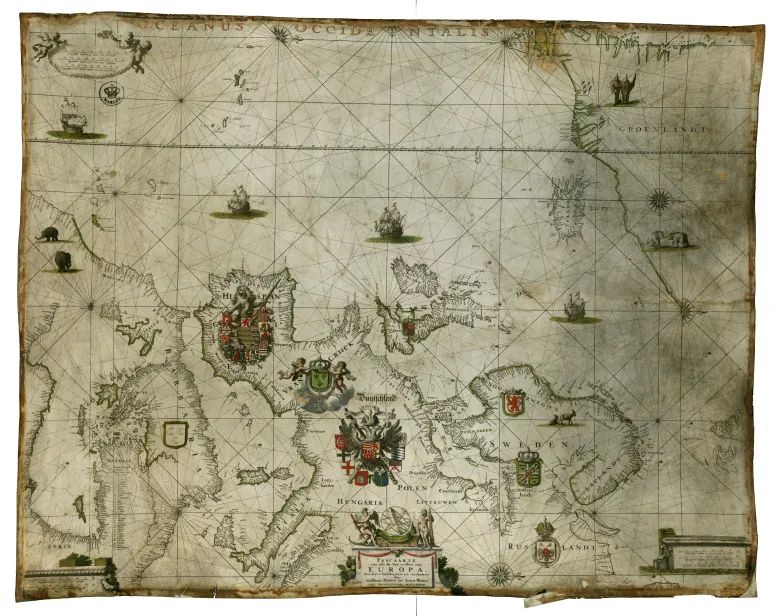
Hand-coloured, printed chart of Europe on parchment by Willem, Pieter & Joan Blaeu, Amsterdam, 1677. S.0860(03)
Chart-making technique
Making a sea chart is complicated: how do you determine exactly where you are at sea? And how do you measure distances and depths? The process is time-consuming, expensive and involves many specialists. In the 17th century, sailors took measurements on the water along the coast and at sea as the basis of sea charts. Over time, special recording vessels replaced them.
Today, the Hydrographic Service makes all sea charts. The service does this for the seas around The Netherlands and in the Caribbean Netherlands. Water depths, tides and hazards such as shallows and wrecks must be carefully determined.
The exhibition shows old surveying instruments such as depth gauges, angle gauges and tide gauges as well as how nautical charts were printed: from the first sketch to the copper plate used to print the chart.
Charting the Sea is on show from 20 June.
This exhibition has been made possible thanks to participants of the VriendenLoterij.